Chart-in-Focus · Free Monthly Newsletter
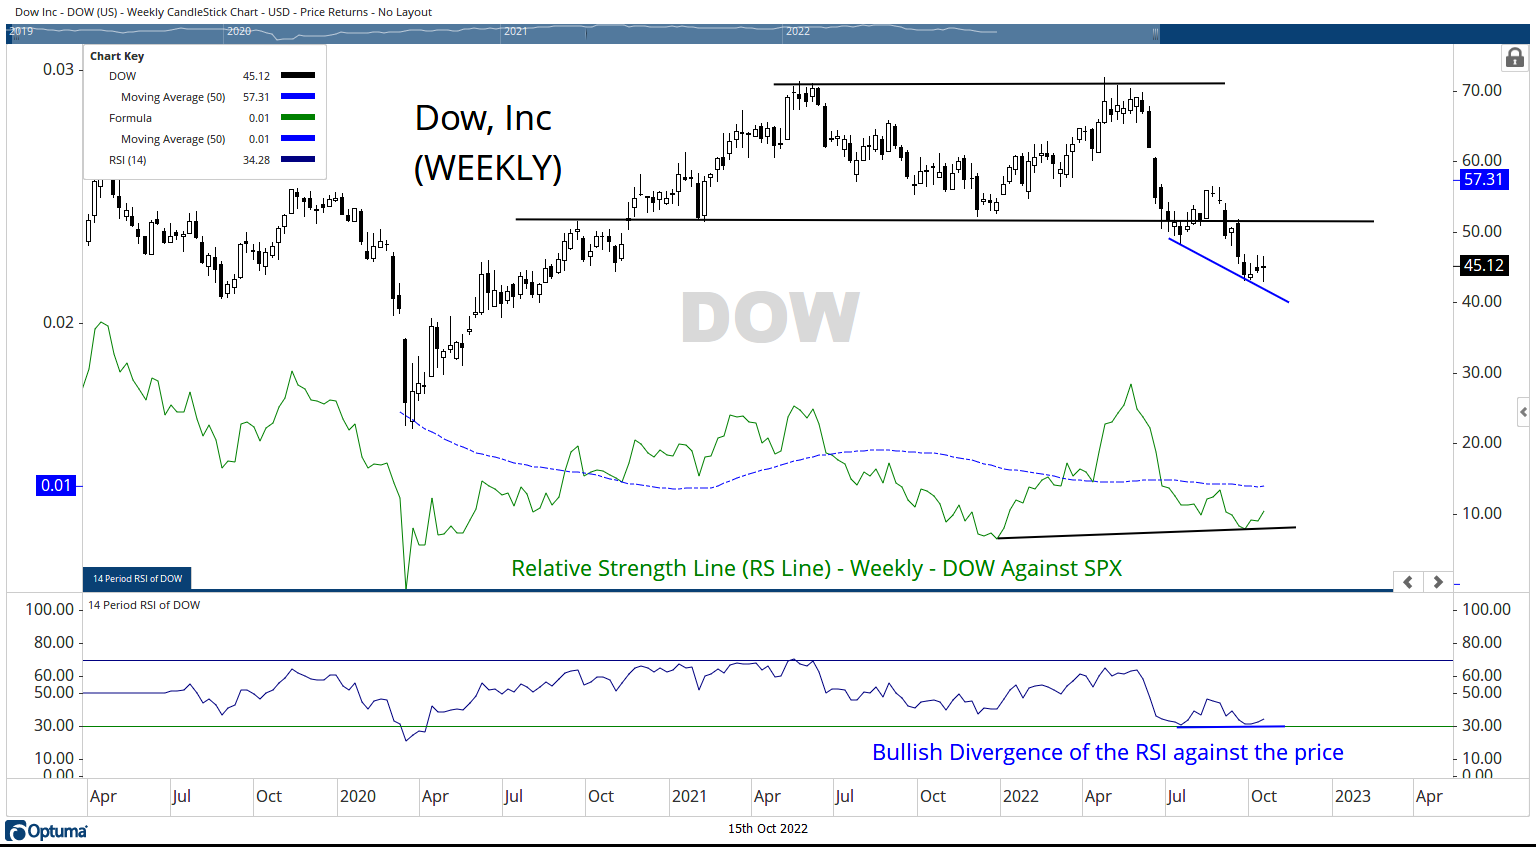
Chart-in-Focus: Strong Signs Of A Bottom In Place For This Stock
Enjoyed this edition?
Subscribe to receive Chart-in-Focus free each month — one market, one idea, examined properly.
No spam. Unsubscribe at any time.